
Cumulative Poisson Distribution Calculation | ||
| Result: | |
Cumulative Poisson Distribution Calculator is an online probability and statistics tool for data analysis programmed to estimate the distribution of random variable within a certain range. An average rate of success and the probability random variable are used here as the input values of this calculator
Definition
Cumulative Poisson Distribution is defined as the measure of the probability in which the average number of success estimated within a range of experiments. When it comes to online calculation, this cumulative Poisson distribution calculator can assist you to find out getting the probability of success. Where λ, Lambda is an Average of Success and X is the Poisson random variable
Formula
Cumulative Poisson Distribution with the instances of k = 0, 1, 2, .., n can be calculated from the formula
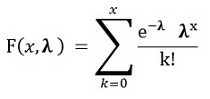
where
e is the base of the natural logarithm equal to 2.71828
k is the number of occurrences of an event; the probability of which is given by the function
k! is the factorial of k
λ is a positive real number, equal to the expected number of occurrences during the given interval
The collection of tools employs the study of methods and procedures used for gathering, organizing, and analyzing data to understand theory of Probability and Statistics. The set of ideas which is intended to offer the way for making scientific implication from such resulting summarized data. In many applications it is necessary to calculate the probability of average number of success, where this Cumulative Poisson Distribution calculator can assist you to effortlessly make your calculations for given data
Here you can get cumulative poisson distribution table, cumulative poisson distribution calculator, cumulative poisson distribution excel, cumulative binomial distribution, cumulative exponential distribution, cumulative normal distribution, cumulative gamma distribution, cumulative uniform distribution.
累积泊松分布计算器
泊松分布描述单位时间或空间内稀有事件的发生次数,比如每小时来电数、每平方米缺陷数。累积概率 P(X ≤ k) 表示“最多发生 k 次”的概率,是排队论、质量控制和服务容量规划的核心计算。
使用方法
- 填入平均发生率 λ(期望次数)
- 填入观察次数 k
- 读取恰好 k 次的概率与累积概率 P(X ≤ k)
计算公式
| 概率质量 | P(X=k) = λ^k · e^(−λ) / k! λ 为平均发生率 |
|---|---|
| 累积概率 | P(X≤k) = Σ P(X=i),i = 0…k 逐项累加 |
| 期望与方差 | E(X) = Var(X) = λ 泊松分布的特性:均值等于方差 |
| 二项近似 | λ = n·p,n 大 p 小时成立 n ≥ 20 且 p ≤ 0.05 时近似良好 |
计算示例
- P(0) = e⁻⁴ ≈ 0.0183
- P(1) = 4·e⁻⁴ ≈ 0.0733
- P(2) = 16·e⁻⁴/2 ≈ 0.1465
- P(X≤2) ≈ 0.238
- t(均值 λ)填 2、x 填 3,点 Calculate
- 逐项算 P(k) = 2^k · e⁻²/k!:P(0) = 0.1353、P(1) = 0.2707、P(2) = 0.2707、P(3) = 0.1804
- 累加:0.1353 + 0.2707 + 0.2707 + 0.1804 = 0.8571
- 页面对总和四舍五入到 4 位小数,结果栏显示 0.8571
要点与常见误区
- 泊松要求事件相互独立且发生率稳定,有明显高峰时段的场景不适用。
- λ 越大分布越接近正态,λ > 20 时可用正态近似简化计算。
- 均值等于方差是重要检验点:实际数据方差远大于均值说明存在过度离散。
- x 必须是非负整数:页面直接拿 x 做阶乘循环,填 2.5 会按 2.5、1.5、0.5 一路乘下去得出无意义结果,填负数输出 NaN。要算 P(X≤3) 就填 3,不是填 0 到 3 的区间
- 页面只显示累积值,单点概率 P(X=x) 在源码里算了但不显示;要"恰好 x 次"就用相邻两个累积值相减,例如 P(X=3) = P(X≤3) − P(X≤2) = 0.8571 − 0.6767 = 0.1804
常见问题
- 泊松和二项分布什么关系?
- 泊松是二项分布在 n 很大、p 很小时的极限形式,用于描述稀有事件。
- λ 可以是小数吗?
- 可以。λ 是期望次数,取 2.5 表示平均每单位时间发生 2.5 次。
- 为什么方差等于均值?
- 这是泊松分布的数学性质,来自事件独立且发生率恒定的假设,可用它检验数据是否真的服从泊松。
- λ 和 x 分别填什么,λ 能填小数吗
- λ 填单位时间的平均发生次数,可以带小数:每 10 分钟平均 1.5 次就填 1.5。x 填累积上限,必须是非负整数。λ=1.5、x=2 时 P(X≤2) = 0.2231 + 0.3347 + 0.2510 = 0.8088
- 算"至少发生一次"用这个页面吗
- 用补集最快:P(X≥1) = 1 − P(X=0) = 1 − e^(−λ)。λ=2 时 = 1 − 0.1353 = 0.8647;页面填 x=0 直接给出 0.1353,拿 1 减它即可。同理"超过 x 次"= 1 − 页面输出
- x 多大时结果可以当 1 看
- P(X≤x) 随 x 单调升到 1。经验门槛 x ≥ λ + 3√λ:λ=2 时 x ≥ 7,P(X≤7) = 0.9989;λ=6 时 x ≥ 14,P(X≤14) ≈ 0.9986。过了这条线再加大 x,第 4 位小数基本不动,容量规划可以按 100% 处理
相关计算器
- 调和平均数在线计算器
- 超几何分布计算器
- 四分位数间距(IQR)计算器
- 峰度系数计算器
- 线性回归方程计算器
- 误差界限 误差范围计算器
- 平均绝对误差计算器
- 样本标准偏差在线计算器
- 算术平均值在线计算器
- Arithmetic Mean Calculator